What is INP and why does it matter
Interaction to Next Paint (INP) is the new core web vitals metric from Google which measures the responsiveness of your website. INP is replacing another vital metric called First Input Delay (FID) on March 12, 2024 according to Google.
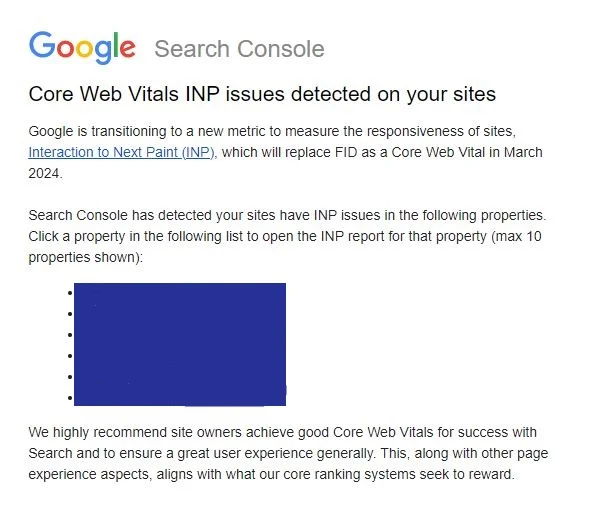
If you are using Google search console and your INP score is less than recommended then you might have received a similar message from Google as below.
Interaction to Next Paint (INP)
INP measures the time delay between the initial time when a user interacts with your website and the time when the user sees the response on the website.
How INP will replace FID as the New Core Web Vital metric
As we have mentioned earlier, Google has sent mails regarding INP becoming the next core web vital metric replacing FID. This is no longer experimental as the change will be implemented on 12th March this year.
Being a stable core web vital metric does not happen instantly though. The new metric INP had gone through the lifecycle of 3 phases that are:
Experimental metrics: Testing and implementing significant changes in the metric through community feedback
Pending metrics: Passed testing phase but need to go through a certain time period to be stable
Stable metrics: As the name suggests the metric is now considered and implemented as an important one for core web vitals.

If you are interested to know how web vitals are considered by Google then you can read their web vitals article and their article on how thresholds are defined for each core web vitals metric.
Benefits of Optimizing INP for Your Website
Lower Bounce Rate and Higher Engagement Rate: Website visitors do not like to wait and a high INP indicates that they will leave your website frustrated. A low INP will help you achieve lower bounce rate and higher engagement rate.
Improved User Experience (UX): A low INP indicates that your website responses fast to visitor interactions. This result in visitors spending more time on your website and feeling satisfied. So this is an important factor to measure user experience on your website.
Improved SEO Ranking: Google considers INP as one of Core Web Vitals metrics that measures page experience of a website. And so undoubtedly this is a ranking factor for Google search engine results page (SERP) and contributes to SEO ranking of your website.
Understanding INP
Now that you have a clear idea about how important this metric is for your website, you might be eager to learn about it.
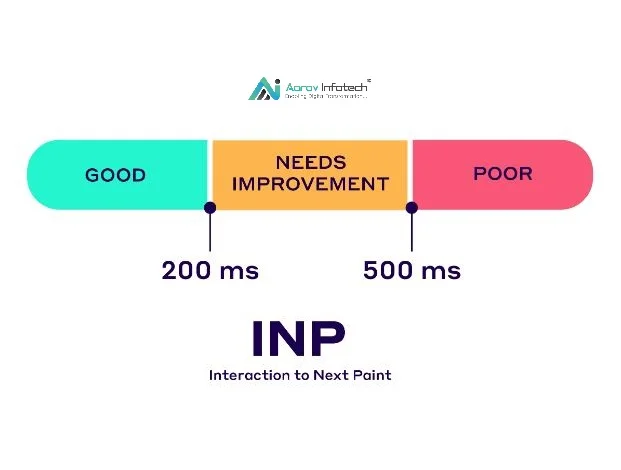
Considering other Core Web Vitals metrics, your INP score can be placed in one of the 3 thresholds below:
Good: 0-200ms
Needs Improvements: 200-500ms
Poor: >500ms
To understand INP you need to understand interaction delay. Interaction delay is the delay or time lag between user action/input time and website response/output time. This can be divided in 3 phases.
Input Delay: This the delay between when a website visitor starts interacting (website through mouse, keyboard or touch screen) with your website and the time when an event is called or starts as a response to the interaction. This includes input understanding operational delay and delays caused by the input device.
Processing Time: This is the time required for analyzing and processing an input, calculate or do necessary operations and then creating the appropriate response.
Presentation Delay: This is the delay by system in which period it delivers the response or output on display including rendering images, updating user interface and other elements on the screen.
These are dependent upon the server or system computational power, network speed and some other factors which we will go through soon.
Which Factors Contribute to INP Core Web Vital Issue
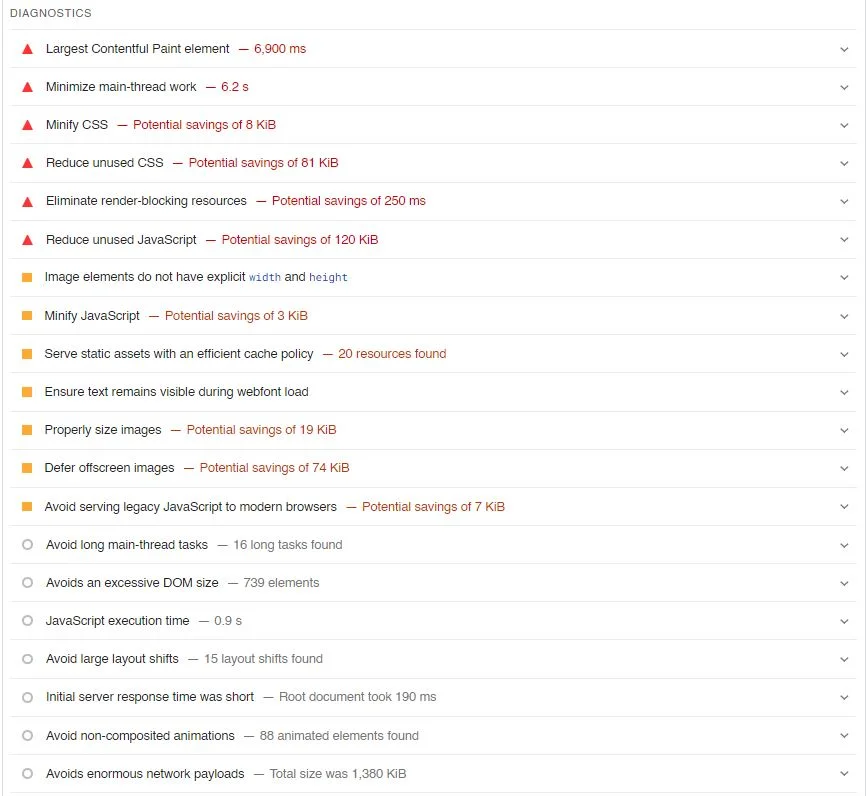
Do you want to understand which are the main culprits for INP issues? Ok, below are the important factors for the error message you might be getting “INP issue: longer than 200ms”.
Largest Contentful Paint (LCP):
LCP is the time duration for the biggest and often most exciting content/element to appear on your screen when you visit a website. In short it measures and tells us how fast that main content or important stuff shows up for you.
The faster it appears, the happier your website visitors will be, not waiting for a long time and getting hooked.
Minimizing Main Thread Work:
Main thread work includes important processes like parsing HTML and CSS, rendering graphics, script compilation, script evaluation, style and layout etc. Minimizing main thread work is basically reducing the amount of processing the main thread of a browser has to do itself.
How to do it? By optimizing/minifying HTML/CSS codes and offloading non-essential tasks to other threads. This helps in processing only essential tasks which enables main thread to focus on delivering smooth user experience.
Minifying JS and CSS and Reducing Unused or Legacy JS and CSS:
Latest Javascript (JS) and Cascading Style Sheets (CSS) codes should be used. You can further improve performance by minifying both and reducing unused codes. This step significantly affects in reducing load time.
How to do it? Developers need to use latest minified versions of both codes. If you are using CMS like WordPress, there are tons of plugins which does it for you.
Excessive DOM Size:
Document Object Model (DOM) is like a tree structure of a web page where each branch ends at a node. These nodes contain different webpage objects such as texts, elements, documents etc. It shows how elements on a webpage are structured and connected with eachother.
If the DOM size is bigger then it takes more time to display webpage elements and make subsequent updates. The more resource intensive the DOM is, longer time needed for page load and thus poorer the user experience becomes. To reduce the DOM size, only important elements needs to be placed here.
How to do it? Optimize HTML, CSS, JS, images, implement lazy load, pagination, infinite scrolling, use server-side rendering- these are some of strategies you must consider to avoid excessive DOM size.
Server Side Rendering:
Server side rendering is considered better for performance, caching, compatibility, faster partial-page load times, SEO friendliness and for slower connections or devices. You can look at the table for better comparison between server side rendering and client side rendering.
|
Feature |
Server-Side Rendering (SSR) |
Client-Side Rendering (CSR) |
|
Rendering |
On Server |
On Browser |
|
Initial Page Load Time |
Slower |
Faster |
|
SEO Friendliness |
Better |
Worse |
|
Performance |
Better performance for slower devices |
Slower performance on slower devices |
|
Caching Implementation |
Easier |
Complex |
|
Initial Server Load |
Higher |
Lower |
|
Browser Compatibility |
Better |
Incompatibility with older browsers |
|
Code Complexity |
Simpler |
Complex |
|
Development Overhead |
Easier to set up and maintain |
More effort for complex applications |
You should note here that server side rendering allows browsers to get HTML in parts faster. It enables browsers to parsing and displaying it faster. In client side rendering it takes more time to display the large HTML/DOM at once.
In short, server side rendering provides better INP score compared to client side rendering.
How to Measure INP
Now you must be asking how I can measure INP metrics of my own website. To measure INP data you need to consider both “Field Data” and “Lab Data”.
We recommend giving more importance to Field data because Lab data simulates user interactions and may vary from real-time user interaction data.
Here is a 3 step process to measure INP:
- Gather INP data from Field and Lab
- Then identify which interactions are comparatively slower
- Final step is to find out why these interactions are slower and work on it
How to measure INP through Field data
Finding out real-time user interactions data or Field data gives a more accurate picture on slower interactions.
You should focus on below points to accurate gauge INP issues:
- The INP value itself to determine if it passes the threshold.
- The element selector string responsible for slower interactions should be considered.
- The loading state of the page for the target interaction whether it happens during page load or after that. If it is during page load, you need to check main thread.
- Capture target interaction's start time to determine its duration.
- The event type to track which event callback is responsible for slow interaction.
How to do it? Below is a step by step guide from Google to measure field data for INP.
Step 1-
You should use a text editor such as Sublime text or Visual studio code.
Step 2-
Use a chromium-based browser such as Google chrome, Microsoft Edge or Brave browser.
Step 3-
Open the text editor and paste below code:
<!DOCTYPE html>
<html lang="en">
<head>
<meta charset="utf-8">
<title>Web Vitals Test</title>
<meta name="viewport" content="width=device-width, initial-scale=1">
</head>
<body>
<p><img style="max-width: 360px" src="https://placekitten.com/g/3840/2160" alt="Kitten" /></p>
<p>Text below image</p>
</body>
</html>
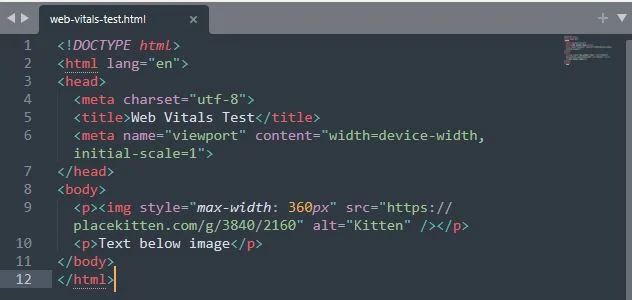
The above code creates a simple webpage with a cat image.
Step 4-
After 2nd
element withinelement paste below code:
<script type="module">
import {getCLS, getFID, getLCP} from 'https://unpkg.com/web-vitals?module';
getCLS(console.log);
getFID(console.log);
getLCP(console.log);
</script>
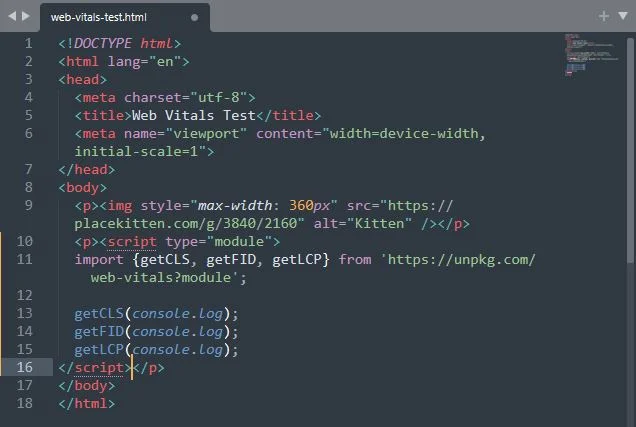
The above code loads web-vitals library from a CDN. Now save the file naming it web-vitals test.html
Step 5-
Open the file in your browser and click inspect after right click. Go to console tab, select settings and tick on Preserve log.

Step 6-
Click network tab, then click on down arrow mark and select Slow 3G.

Step 7-
Go to console tab and click anywhere on the page. Now the LCP and FID metrics will display.
Refresh the page and click again.

How to measure INP through Lab Data
Field data or real-time user interaction data may not be always available in some cases like if the traffic flow is too low for Google to consider. In that case Lab data is always available for any site.
Sometimes if lab data is not available for any reasons such as geography or browser related issues, we recommend using incognito mode. If the lab data is still not showing then use VPN.
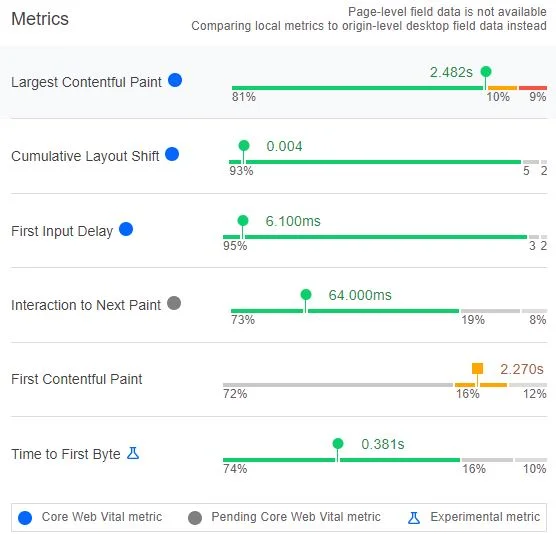
You can access your lab data to measure INP through Lighthouse tool or PageSpeed Insights. The metric you should focus on here is Total blocking time (TBT).

Another fast way to get core web vitals metrics is Web Vitals Chrome extension. After installing the extension, go to any page and then click on this extension.
Interact a little bit with the page and you will see all the metrics populated. Click on the settings of the extension and tick on console logging, save it.
Now you can receive important logs inside chrome developer tools console. In performance panel, you can start recording interactions by clicking the record button. After each interaction, click on it to stop recording and check activity summary. Look for red bars which inform long tasks to identify interaction issues.
How to improve INP Score
Now it is time to improve INP as we have already figured out which elements are causing poor INP score.
Reducing Input Delay
The main culprits in input delay are often the timer functions that are setTimeout and setInterval. setTimeout function schedules a callback to run after a given or specified time where as setInterval function schedules callback to run repeatedly every ‘x’ milliseconds until timer is stopped by clearInterval function.
The function setTimeout is helpful avoiding long tasks but should avoid running during when website visitor interacts with the page. Additionally it can be set to run in loop, but be mindful of it doing excess work.
setInterval is much more likely the cause of slower interactions because of its repeating nature. Check if this can be avoided or simply reduce the work it does in loop.
Reducing Long Tasks
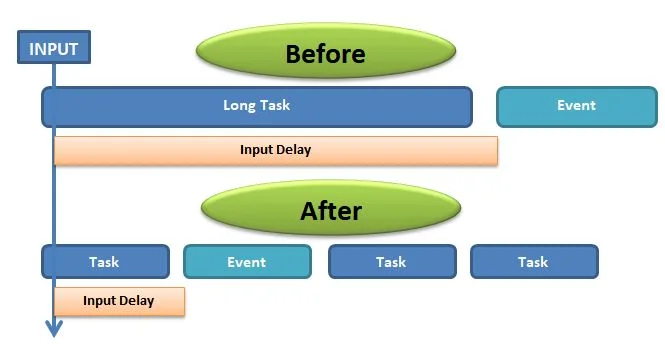
Long tasks can be divided into parts and then be decided to be called according their functionality. If you do that and prioritize the tasks which is visible, then the website visitor will see elements on page more faster. Below are some recommended strategies.
1-Divide a long task or function into smaller ones and prioritize the ones which helps displaying on webpage. Use setTimeout function when you have multiple functions to run in sequence.
2-Use postMessage function for faster timeouts if a task has to process a huge amount of data. You can also use requestIdleCallback function if this huge task is not priority.
3-You can assign the main thread only high priority tasks using a combination of saveSettings(), await, async, yieldToMain() and isInputPending(). This helps minimize main thread work to only high priority user-facing tasks.
Reducing Script Executions
Wouldn’t it be better if you can split large script executions into smaller ones.
Scripts are loaded either through <script> element or type=module attribute. The type=module attribute method of loading ES modules on <script> element is better because in chrome based browsers the compilations steps are broken down. It is better in terms of handling long tasks. Additionally you can use async attribute on them to change its behavior.
If you are using only <script> element then you can break up large JavaScripts into smaller ones using additional <script> elements. But always try to use as little script as possible especially during load time.
Another technique called code splitting can be used using dynamic import(). It can be called anywhere within the script. It separates the compilation and evaluation of each module and modules which are deferred to load later significantly reduce main thread work.
Reducing Interaction Overlap
Interaction overlap occurs when your website visitors start interacting with webpage and when that response is not completed fully, they do the next interaction. This happens in many instances and you can not stop them from doing that.
But you can reduce this issue by:
- Debounce input handlers like touchstart, touchmove, or touchend and preventDefault(). Avoid long-running input handlers and making any style changes in input handlers. Limit the number of times an event callback happens in a specified time period.
- Use AbortController to stop fetch requests so the main thread doesn't overloaded managing fetch callbacks requests.
Reducing Interaction Latency
Interaction latency is the period of time an interaction takes to finish and showing response on the display.
The more layouts for different elements you have, more time is required to determine locations and dimensions of elements. This is determined according to element properties such as widths, heights, left etc.
To reduce this delay
- first and foremost do not change or reduce changing styles as much as possible.
- Use forced synchronous layout which forces a browser to execute layout before script.
- Prioritize doing batch your CSS styles and execute it first.
- Avoid layout thrashing
- consider using FastDOM
Reducing Excessive DOM Size
Reducing excessive DOM size is significant to acquire better INP score. The most important way to reduce DOM size is to reduce its depth. Other ways include:
- Use lazy load HTML
- Reduce CSS selector complexity
- Use CSS property content-visibility
- Reduce JS nodes
- Do not use outdated or poorly coded themes or any plugins
- Avoid using requestAnimationFrame
- Defer ResizeObserver to execute later
Key Takeaways:
INP is replacing FID as the new core web vitals metric. Considering the importance and benefits of core web vitals metrics, you cannot ignore INP. But what you can do to leverage this is to optimize INP to get better score. Below are the key takeaways of what we discussed.
1- Input Delay: If timer functions like setTimeout and setInterval execute during user interactions, they can contribute to higher input delay. Reduce or avoiding excessive loops in these functions as much as possible.
2- Managing Long Tasks: Dividing long tasks into smaller ones always pays off. Use functions such as setTimeout, postMessage, and others to implement this.
3-Handling Scripts: Splitting large JavaScript codes into smaller ones and using dynamic import()for code splitting does excellent job of script handling. Use ES modules with type=module attribute reduce main thread workload.
4- Interaction Overlap: Debouncing input handlers and using AbortController to manage fetch requests, prevent main thread overload.
5- Addressing Interaction Latency: Minimising layout calculations by avoiding repeated style changes, using forced synchronous layout, batching CSS styles, and using FastDOM reduces interaction latency.
6- Reducing DOM Size: Reducing DOM depth and implementing lazy loading HTML content, simplifying CSS selectors and others contribute to efficient DOM structure.
Implementing the above strategies translates into significant improvements in INP scores and overall website performance. On that note regular website maintenance also helps keep your website fast, secure and updated.

Written by: Jitendra Raulo
Jitendra Raulo is the Founding Director at Aarav Infotech India Pvt. Ltd., a leading Web Design and Digital Marketing Company with 11+ years of experience and having headquarter in Mumbai, India, and Support Centre at Bhubaneswar, India, he is actively working with Start-ups, SMEs and Corporations utilizing technology to provide business transformation solution.


